
Data Processing
The processing and analysis of the FTIR measurements requires firstly a preprocessing of the raw interferograms for the generation of spectra and secondly the quantitative analysis of the absorption spectra for the determination of the desired trace gas abundances. For the latter task, a radiative transfer code and an inversion scheme is applied which fits synthetic spectra to the measurements. For this purpose, the KIT offers source-open tools for both the preprocessing PREPROCESS and the subsequent quantitative trace gas analysis named PROFFAST. PREPROCESS has been developed in the framework of the COCCON-PROCEEDS project supported by ESA. PROFFAST has been developed at KIT to offer a user-friendly application for the trace gas analysis with an optimized performance. PROFFAST accepts *.mod files as used in TCCON for ensuring identical choices for the temperature and water vapor profiles, and the a-priori vertical profiles of the target gases.
PROFFAST Software and Manuals
New PROFFAST Software:
PROFFASTv2.4.1 (Version 2.4.1)
Please download the PROFFASTpylot first in order to run PROFFASTv2.x.
PROFFASTpylot Version 2.4.1-0 requires PROFFASTv2.4.1.
Outdated PROFFAST versions are still available on Previous Versions.
ILS Characterization:
ILS-Characterization-and-Required-Parts (December 02, 2014)
PROFFASTpylot:
Repository PROFFASTpylot
The documentation on how to run PROFFASTpylot is part of the GitLab repository.
Example Data: example_data_proffastpylot (June 16, 2025)
Document Download: Instrument-Calibration (April 30, 2021) and Supplement (Alberti et al., 2022)
User Manual PROFFAST (courtesy of P. Schmid/BRUKER): PROFFAST_User-Manual_Dec-2023
User Manual EM27/SUN (courtesy of M. K. Sha): EM27SUN_Operational-Manual_May-2014
Demo BIN Viewer: demo-bin-viewer (August 8, 2025)
TCCON PROFFAST Support: TCCON-Wiki-Caltech

Centralized Processing and Data Dissemination
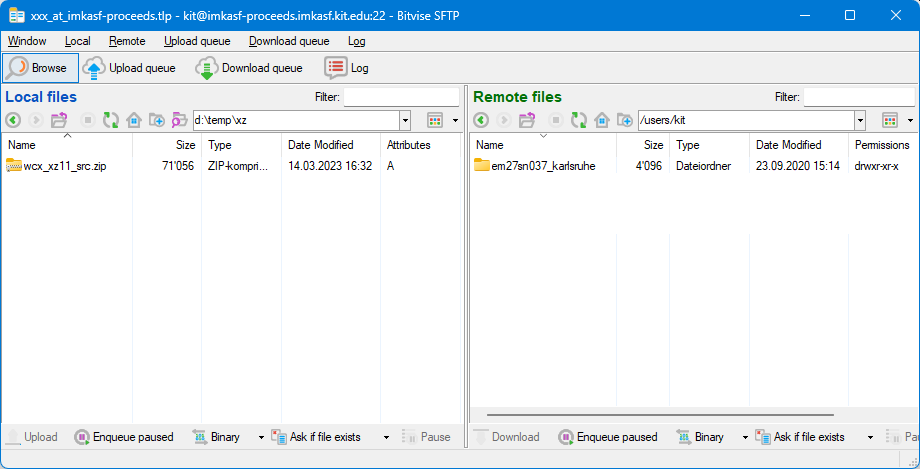
The COCCON Central Processing and Data Handling Facility (CPDHF) is an easily accessible web-based framework for storing calibrated spectra, for performing the quantitative trace gas analysis and for data dissemination to the user community.
Spectra generated using PREPROCESS can be uploaded by the spectrometer operators and the trace gas analysis will be performed at the CPDHF using PROFFAST. The facility can also be used to make the data available to the public if desired. Spectra stored at the central facility will be reanalyzed when a new version of PROFFAST becomes available (e.g. improved line lists).

Account on the Central Facility
Preparations (if not already done):
- Install any ssh-client on the device you like to use as remote (e.g. for Windows: Bitvise SSH client from Bitvise Website)
- Create your "personal" SSH v2 key pair (we recommend to use ed25519 or rsa encryption with ≥ 4096 bits keylength)
- Keep the private part of the key pair secret !!!
- Send us the public part of the key pair by email
- Choose a user name (e.g. "kit" for KIT, Karlsruhe)
Please feel free to contact us if you encounter any problems. For help with all the preparations please contact your IT staff first (they know best which software to use and how to install it on your computer).
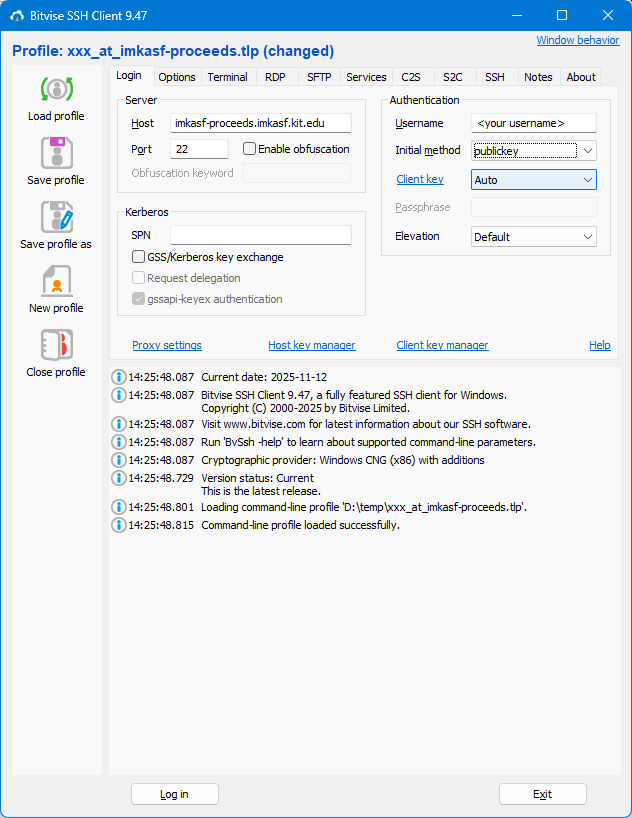
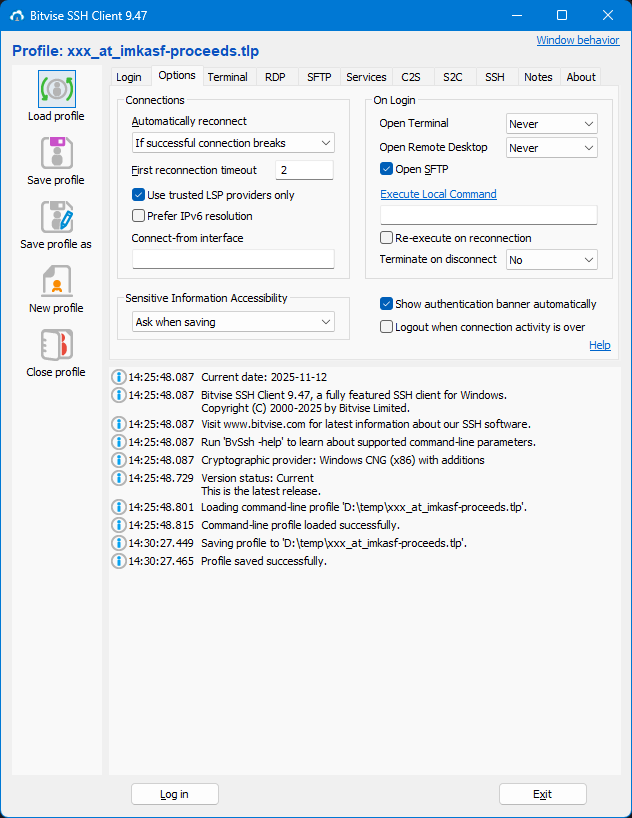
In order to log in for data exchange, we recommend the software Bitvise for Windows users. But in principle any SSH software can be used for this purpose.
Information about the settings
| Host | imkasf-proceeds.imkasf.kit.edu |
| Port | 22 |
| Username | (your username) |
| Initial Method | publickey |
| Client Key | Auto |
| Passphrase | (your passphrase) |
Data Format
For future data evaluations on the Central Facility and for generating GEOMS compliant HDF output files (as used by ESA and NASA for validation of spaceborne sensors) the desired name, the affiliation, the address and the email of the Principal Investigator (PI), of the Data Originator (DO), and of the Data Submitter (DS) of your EM27SUN site has to be provided. Please also note the pdf document geoms-1.0 and the EVDC ESA data protocol.
The choice of the meta-information (PI, DO, DS) can be context-sensitive, e.g. several choices per spectrometer and/or per campaign timeframe can be provided, if required.
The entries for the name, affiliation and address are required in a specific format. Two entries for the name and affiliation as well as three entries for the address are mandatory, each separated by a semicolon. The valid entries for the affiliation and the country are listed in the file tableattrvalue_04RXXX.dat.
An example for measurements taken in Karlsruhe is given below, showing the necessary format:
PI_NAME = Hase;Frank
PI_AFFILIATION = Karlsruhe Institute of Technology;KIT
PI_ADDRESS = P.O. Box 3640;D-76021 Karlsruhe;GERMANY
PI_EMAIL = frank.hase@kit.edu
DO_NAME = Alberti;Carlos
DO_AFFILIATION = Karlsruhe Institute of Technology;KIT
DO_ADDRESS = P.O. Box 3640;D-76021 Karlsruhe;GERMANY
DO_EMAIL = carlos.alberti@kit.edu
DS_NAME = Dubravica;Darko
DS_AFFILIATION = Karlsruhe Institute of Technology;KIT
DS_ADDRESS = P.O. Box 3640;D-76021 Karlsruhe;GERMANY
DS_EMAIL = darko.dubravica@kit.edu
Column Sensitivities
For comparing observations collected with different remote sensing instruments or for comparing remote sensing observations with model data, the limited capability of the remote sensing observation in reconstructing the actual atmospheric state needs to be taken into account. In general, this requires the a-priori profile which was used for the retrieval and the averaging kernel matrix, which specifies the loss of vertical resolution (fine vertical details of the actual trace gas profile cannot be resolved) and sensitivity (the retrieved total column differs from the actual column amount) [e.g. Rodgers, 2000 or Rodgers, 2003]. In the case of COCCON, the spectrometers used be the network offer only a low spectral resolution of 0.5 cm-1. Therefore, performing a simple least squares fit by scaling retrieval of the a-priori profile is generally appropriate. In this case, there is no need to specify a full averaging kernel matrix, instead, the specification of a total column sensitivity is sufficient. The total column sensitivity is a vector (being a function of altitude), which specifies to which degree an excess partial column superimposed on the actual profile at a certain input altitude is reflected in the retrieved total column amount (ideally, the sensitivity at each level is unity). The resulting sensitivity vector is a function of solar zenith angle (and ground pressure), mainly due to the fact that the observed signal levels in different channels building the spectral scene used for the retrieval are shaped by a mixture of weaker and stronger absorptions (if all spectral lines in the spectral scene would be optically thin and too narrow to be resolved by the spectral measurement, the sensitivity would approach unity throughout).
In the accompanying figures we present pressure-dependent column sensitivities for carbon dioxide, carbon monoxide and methane. These sensitivities are derived from measurements performed in Karlsruhe on May 7, 2018. The solar zenith angles during the measurement time range from 32° to 61°. The shape and values of the column sensitivities from Karlsruhe closely resemble the results derived by Hedelius et al. (2016) in Pasadena.


Quality Check Flags
The Quality Check (QC) Philosophy:
Sequential QCs are performed along the processing chain of each OPUS file. The processing of the measured data stops if one QC test fails. If the DC variation of IFG is too high, for example, the FFT and all subsequent steps are omitted. In this case, no output spectrum is generated, just the error flag state in the log file listing the QC status for each measurement. The QC flags are given for both channels separately. FWD and BWD QC flags are resolved, where values of 0, 1, and 2 are possible.
Quality Check Procedure:
In the beginning, a formal test checking whether a submitted OPUS file is compatible with COCCON and the functional extent of the preprocessor is executed. If this test fails, no flag is generated, program execution is stopped altogether. All subsequent tests modify the reported flagging state. The total flagging state of each spectrum is mapped on a single integer number. A spectrum passing all tests has flag content 0 000 000 000 (10 zeroes). Each test modifies a certain position in this integer.
| QC 1 | solar elevation angle too low (less than 1°) |
| QC 2 | IFG DC value too small relative to available ADC range |
| QC 3 | IFG DC variation too high |
| QC 4 | 1000: relative change of IFG centerburst amplitude between FWD and BWD too high 3000: FWD / BWD IFG centerburst positions differ significantly |
| QC 5 | insufficient number of IFG points for specified resolution |
| QC 6 | out-of-band artefacts too high |
| QC 7 | insufficient number of IFG points for phase calculation (in one of single sided IFG recording) |
| QC 8 | spectral calibration significantly differs from reference spectrum |
| QC 9 | compare spectra derived from forward and backward scans; the test is applied after allowing for an overall ordinate scaling factor for adjustment; the summed difference between the spectra should not exceed a predefined threshold |
| QC 10 | in case of analytical phase option: analytical phase fit significantly differs from raw phase |
List of output variables and definitions
The input file of "invers.inp" is organized in jobs. Each job is based on a selected microwindow and a selected retrieval strategy, for all species possibly relevant. The entire collection of molecular species in the standard setup is:
H2O (gas01), HDO (gas02), CO2 (gas03), CH4 (gas04), N2O (gas05), CO (gas06), O2 (gas07), HF (gas08).
A gas can be neglected altogether (choice 0 in "invers.inp"), can be taken into account in the forward calculation assuming the a priori concentration profile (choice 1 in "invers.inp") or can be retrieved by scaling the a priori concentration profile (choice 2 in "invers.inp").
| Variable name | Definition |
|---|---|
| JulianDate | count of days (January 1, 2000, 12:00 UTC (noon) = 2451545.0) |
| YYMMDD | date format |
| UTtimeh | decimal UTC hours |
| spectrum | spectrum measured in specific time interval |
| gndPmap | surface pressure according to model [hPa] |
| gndP | measured surface pressure [hPa] |
| gndTmap | temperature according to model in lowest layer [K] |
| gndT | measured temperature in lowest layer [K] |
| latdeg | observer latitude in degrees |
| londeg | observer longitude in degrees, East positive |
| altim | observer altitude [m] |
| appSZA | apparent solar zenith angle in degrees |
| azimuth | solar azimuth angle (south = 0°) in degrees |
| Variable name | Definition |
|---|---|
| XH2O | DMF(1) of water vapor [ppm], derived in spectral window 1 |
| XDUM1 | DMF of co-fitted species #1 (H2O as interfering species in window 2) |
| XAIR | DMF of dry air [ppm], derived in spectral window 2 |
| XDUM2 | DMF of co-fitted species #2 |
| XCO2 | DMF of CO2 [ppm], derived in spectral window 3 |
| XDUM3 | DMF of co-fitted species #3 |
| XDUM4 | DMF of co-fitted species #4 |
| XCH4 | DMF of CH4 [ppm], derived in spectral window 4 |
| XDUM5 | DMF of co-fitted species #5 |
| XDUM6 | DMF of co-fitted species #6 |
| XCO2_STR | DMF of CO2 [ppm], derived from strong CO2 band in spectral window 5 [ppm] |
| XDUM7 | DMF of co-fitted species #7 |
| XDUM8 | DMF of co-fitted species #8; proxy for XHDO |
| XCH4_S5P | DMF of CH4 from spectral band used by Sentinel-5P [ppm], derived in spectral window 6 |
| XCO | DMF of CO [ppm], derived in spectral window 6 |
| Spectral window | Spectral range |
|---|---|
| Window 1 | 8353.4 to 8463.1 cm-1 |
| Window 2 | 7765.0 to 8005.0 cm-1 |
| Window 3 | 6173.00 to 6390.00 cm-1 |
| Window 4 | 5897.00 to 6145.00 cm-1 |
| Window 5 | 4820.00 to 4884.00 cm-1 |
| Window 6 | 4208.7 to 4318.8 cm-1 |
| Variable name (job example) | Definition |
|---|---|
| job01_niter | number of Iterations |
| job01_rms | RMS of fit residual, normalized by mean value in spectral window |
| job01_gsf01 | gas scaling factor applied on a priori profile of fitted gas 01 in job 01 |
| job01_gas01 | total column of fitted gas 01 in job 01 |
| job01_bsl01 | description of background continuum in microwindow 01, grid point value 01 out of 08 |
| job01_bsl02 | description of background continuum in microwindow 01, grid point value 02 out of 08 |
| job01_bsl03 | description of background continuum in microwindow 01, grid point value 03 out of 08 |
| job01_bsl04 | description of background continuum in microwindow 01, grid point value 04 out of 08 |
| job01_bsl05 | description of background continuum in microwindow 01, grid point value 05 out of 08 |
| job01_bsl06 | description of background continuum in microwindow 01, grid point value 06 out of 08 |
| job01_bsl07 | description of background continuum in microwindow 01, grid point value 07 out of 08 |
| job01_bsl08 | description of background continuum in microwindow 01, grid point value 08 out of 08 |
| job01_scl | fitted spectral scale factor in microwindow 01 |
| job01_sol | spectral detuning of solar vs atmospheric absorptions in microwindow 01 |
| Molecular species | Definition | Variable name |
|---|---|---|
| H2O | TC(2) of H2O [molecules m-2], derived in spectral window 1 | job01_gas01 |
| CO2 | TC of CO2 [molecules m-2], derived in spectral window 3 | job03_gas03 |
| CH4 | TC of CH4 [molecules m-2], derived in spectral window 4 | job04_gas04 |
| CO2_STR | TC of CO2 derived from strong CO2 band in spectral window 5 [ppm] | job05_gas03 |
| CH4_S5P | TC of CH4 from spectral band used by Sentinel-5P [molecules m-2], derived in spectral window 6 | job06_gas04 |
| HDO | TC of deuterium hydrogen oxide (HDO), derived in spectral window 6 | job06_gas02 |
| CO | TC of carbon monoxide (CO) [molecules m-2], derived in spectral window 6 | job06_gas06 |
| O2 | TC of oxygen (O2) [molecules m-2], derived in spectral window 2 |
(1)DMF: column-averaged dry-air mole fractions [ppm]
(2)TC: total column amount of molecules in molecules m-2